Vladimir Lebedev
Back to Home Screen
Product development & Implementation
Product development & Implementation
MVP: Predictive Diagnostics of Diesel Engines Based on Big Data from Telemetry and Oil Analysis
MVP: Predictive Diagnostics of Diesel Engines Based on Big Data from Telemetry and Oil Analysis
Budget: $100 000
Budget: $100 000
Timeline: 5 months
Timeline: 5 months
Scope & Objectives
Scope & Objectives
Scope & Objectives
The development of an MVP product was carried out in collaboration with the client. Six underground machines were equipped, and engine telemetry data was collected over a five-month period.
Based on the collected data, patterns and indicators of accelerated engine wear were identified, along with signs of improper machine operation by drivers. The MVP was deemed successful and economically viable.
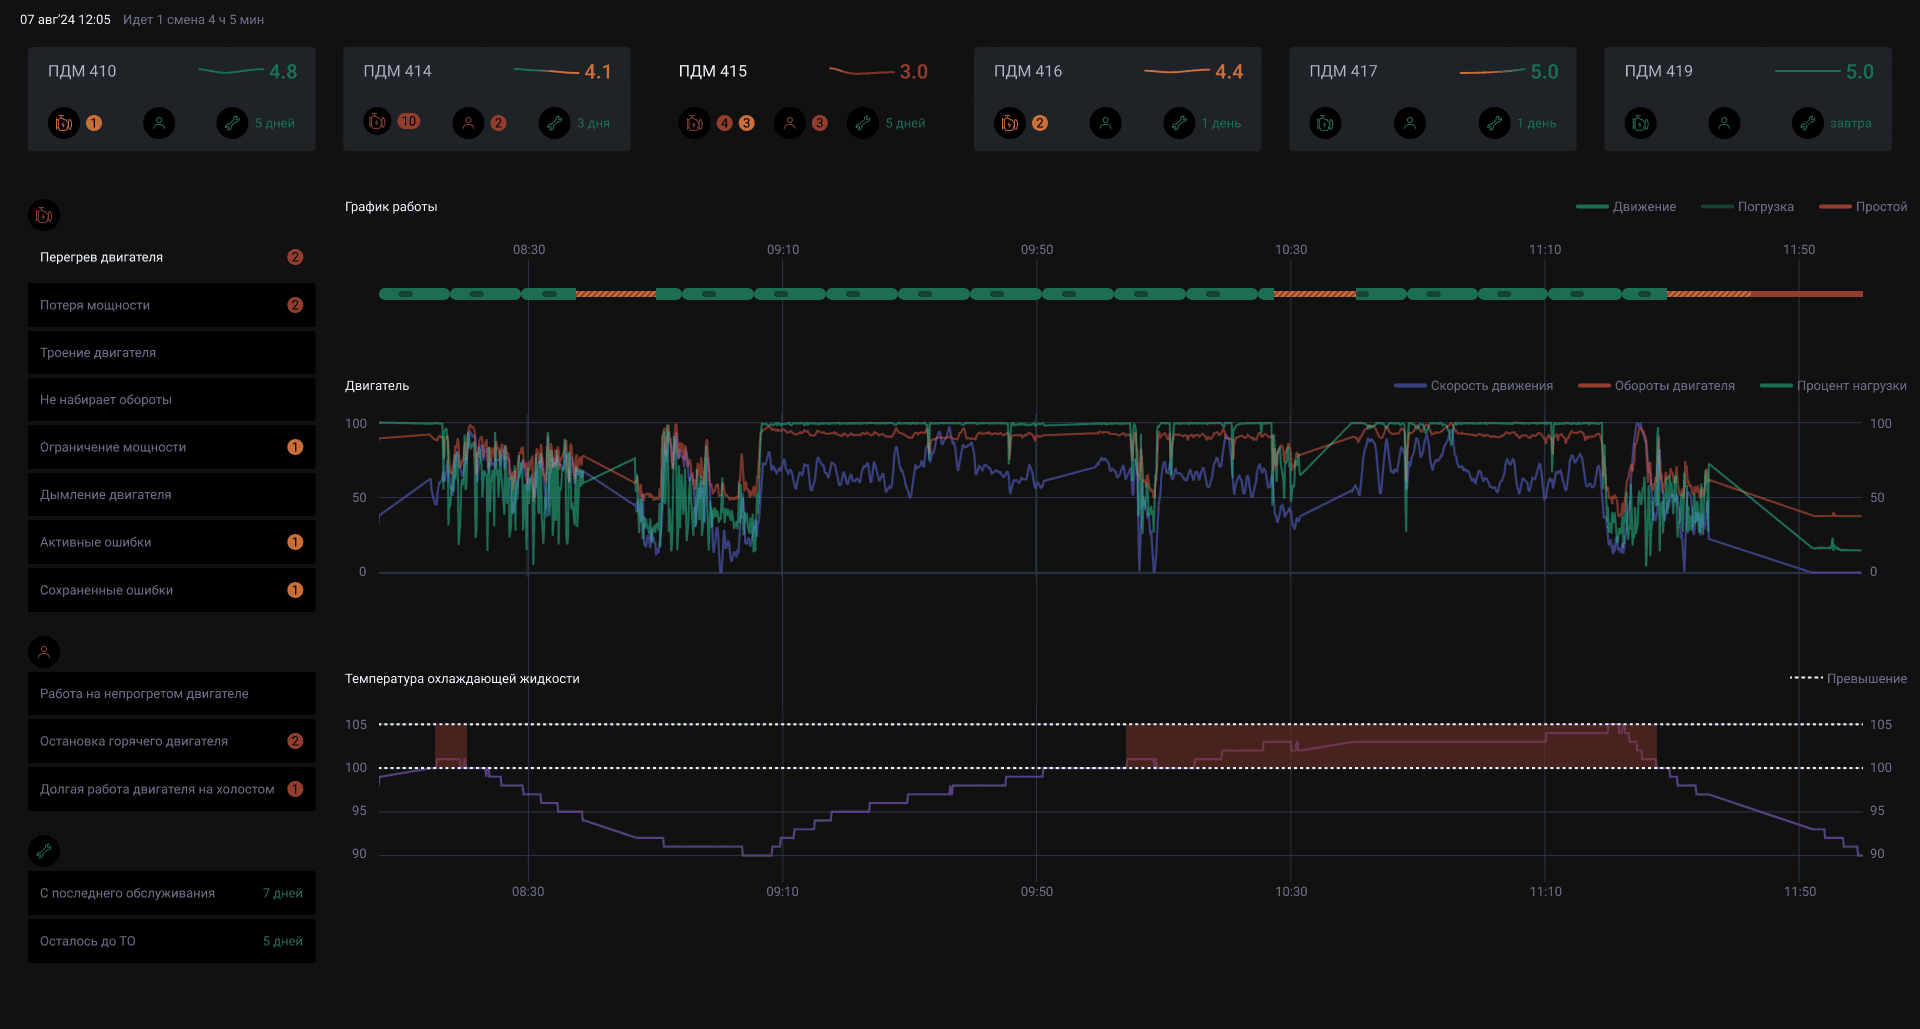
For example, in this graph, it is evident that the operator started intensive work before the engine reached its optimal operating temperature. This practice reduces engine lifespan.
The development of an MVP product was carried out in collaboration with the client. Six underground machines were equipped, and engine telemetry data was collected over a five-month period.
Based on the collected data, patterns and indicators of accelerated engine wear were identified, along with signs of improper machine operation by drivers. The MVP was deemed successful and economically viable.
For example, in this graph, it is evident that the operator started intensive work before the engine reached its optimal operating temperature. This practice reduces engine lifespan.

Further product development is planned, with additional functionalities, including the integration of engine oil laboratory analysis data and repair history data from the SAP system.
The screenshot displays a prototype of the user interface, where the operator can view an aggregated assessment of the machine’s “health” status, along with detailed insights into operator errors from the previous operating period. It also includes a graph of operating and idle modes, engine load percentage, and other key performance data.
I also have a publication on this topic, which I describe here
I also have a publication on this topic, which I describe here